Optoelectronic Feedback
Page under construction. Content related to chaotic circuits, photonics experiments, and feedback modeling.
Background
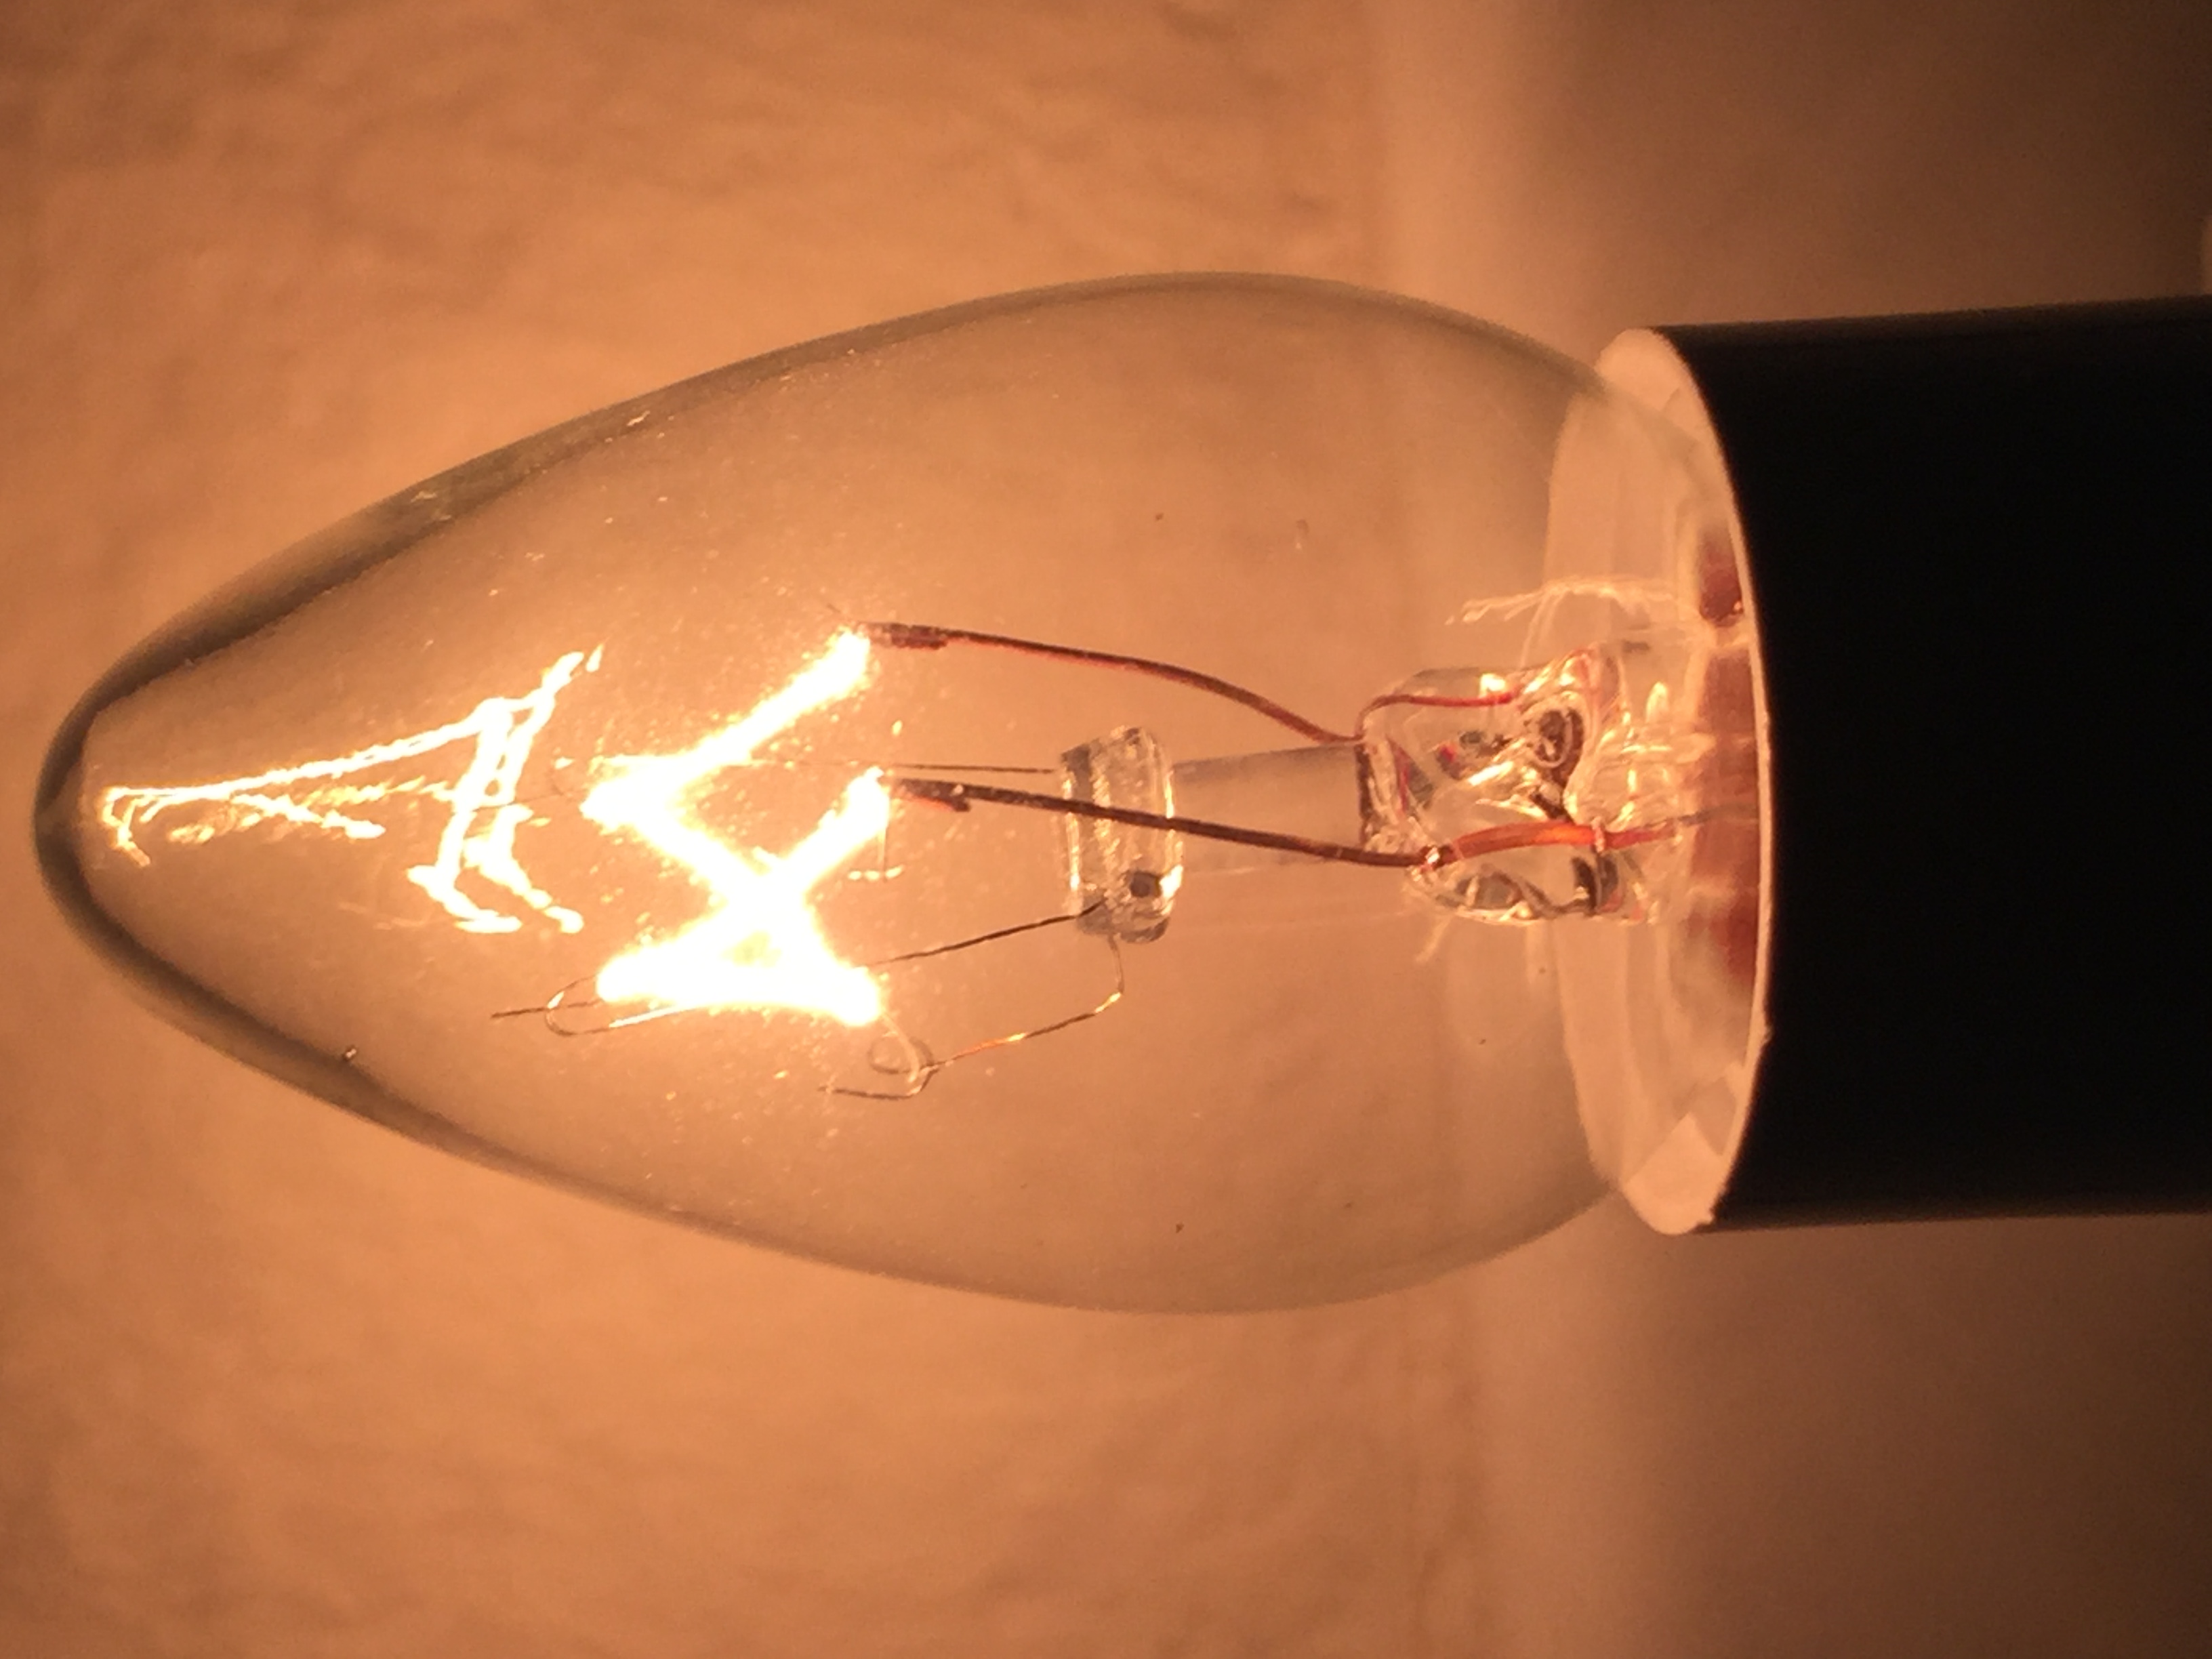 This site presents a study that analyzes light phenomena from a Newtonian-based physics perspective, which is interesting, especially in today's more quantum-based perspectives on light phenomena. At the heart of this project is a classic tungsten-filament incandescent bulb. When driven by a modulated source such as a 120 V, 60 Hz wall mains (USA), the optical and thermal dynamics of the bulb encode nonlinear characteristics we exploit for chaotic masking and other applications. Recent analyses estimate the thermal time constant of tungsten filaments, \( \tau \), to be approximately 93 milliseconds—consistent with observed brightness and decay dynamics of incandescent bulbs [1]. This value reflects the cooling rate of the filament after its source is turned off. Based on brightness levels and the coil’s effective area, we estimate the peak filament temperature and thermal time constant of the filament.
Tungsten Filament Heat Loss
Newton's Law of Cooling states a body's rate of heat loss is proportional to the difference in temperature between the body and its surroundings. For cooling near room temperature, \( T_{\text{room}} \), the law states:
where \( k \) is a constant. For filament temperatures much greater than the room, \( T - T_{\text{room}} \approx T \). The equation above can then be solved via separation of variables to give an expression of filament temerature as a function of time and its physical parameters:
where \( \tau = 1/k \) and \( T_0 \) is the initial temperature of the filament.
Brightness Decay Model
At a set distance from the bulb, the observed brightness \( B(t) \) is proportional to the bulb’s power, meaning \( B \propto P \). Stefan–Boltzmann’s law, \( P = \epsilon \sigma A T^{4} \), determines the filament’s power as a function of its temperature. Raising the temperature expression to the fourth power, setting \( B_0 = T_0^4 \) and \( \tau^* = \tau / 4 \), gives the model:
In this way, \( B_0 \) is the bulb’s initial brightness and \( \tau^* \) is its brightness time constant. Theoretically, \( \tau^* \le \tau \) implies that the bulb’s brightness decays more rapidly than its thermal temperature. For this project, brightness is expected to decay approximately four times faster than temperature.
Brightness in a Box
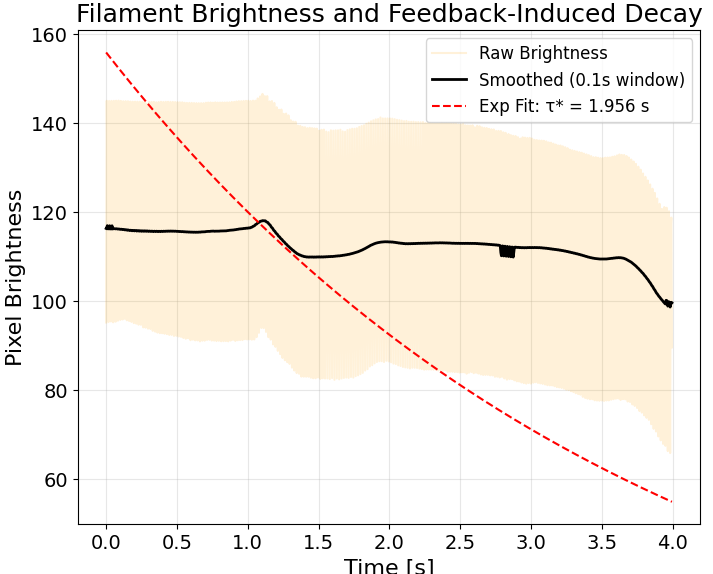 Analogous to beam attenuation studies in atmospheric propagation, the filament brightness over time was estimated using a time-resolved “power in a box” measurement [2, 3]. For each frame, the central region of each video frame was computed and served as a spatial aperture to capture the bulbs power emission.
The high-frequency oscillations visible in the raw brightness trace are due to filament flicker driven by the 120 V, 60 Hz AC mains supply—consistent with the electrical periodicity of standard U.S. power. Superimposed on this is a clear transition region, where the bulb decays from a high-power, thermally excited state to a lower equilibrium state. Note the excitation before and after the distinct drop. The drop is clearly followed by a quasi-stable brightness recovery stage. These characteristics resemble the response of a bistable system transitioning across a potential barrier. The smoothed curve suggests dynamics similar to a double-well potential, where the system briefly occupies a metastable intermediate before settling into a new low-power configuration.
Audio Attractors
Experiments were conducted In the winters of 2016 and 2017 on the behavior of tungsten filament bulbs powered by 120V. They used microphones to capture the sounds produced by thermal expansions and flickering light, revealing hidden patterns in the audio. By analyzing these sound recordings, the team created visual representations of chaotic behavior called strange attractors. These findings demonstrated that simple audio methods could effectively study complex systems.
Period 1 Analysis
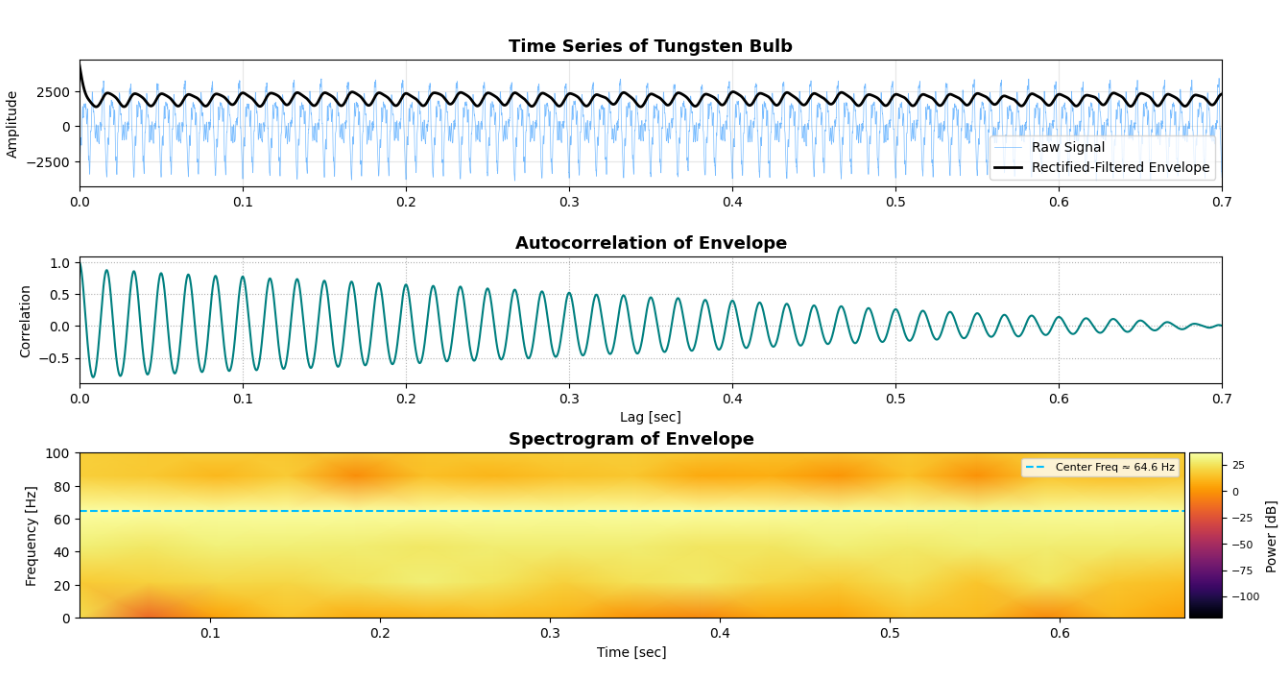
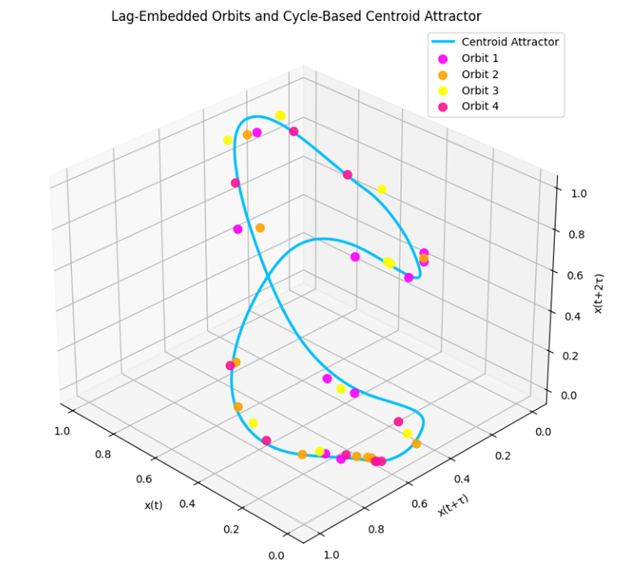
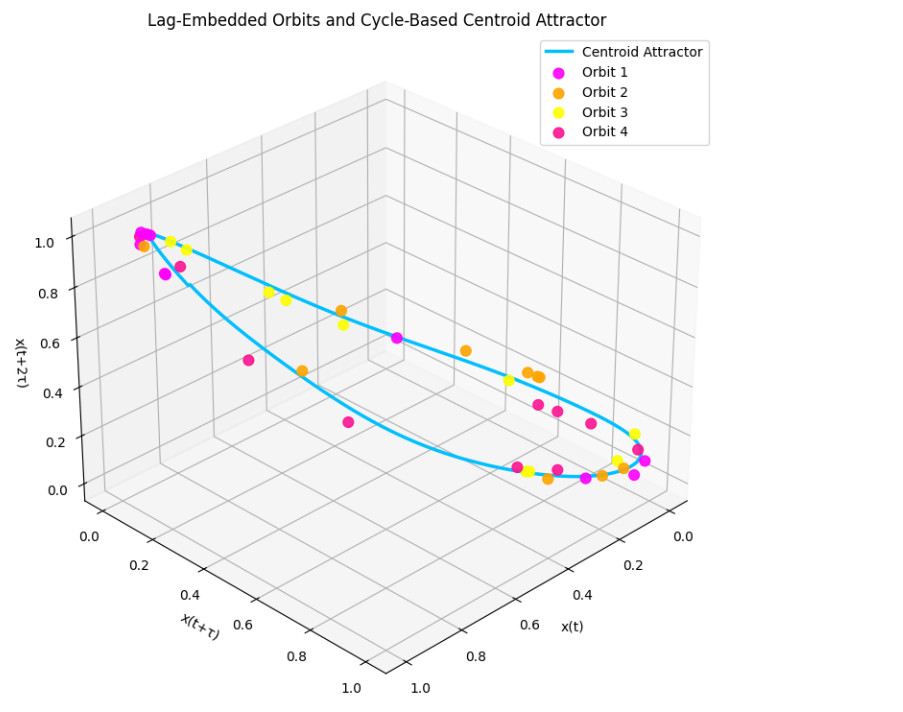 In Period 1, the incandescent filament system was driven into a high-frequency regime with a dominant center frequency of 64.6 Hz. After applying a second-order Butterworth bandpass filter centered at this frequency with a +5% margin, the resulting waveform revealed strong periodic structure and minimal noise contamination. The autocorrelation plot of the filtered envelope displayed a consistent, high-amplitude repetition pattern, affirming the stability of the driving source. Additionally, the phase-space reconstructions from this regime revealed tightly coiled, low-entropy orbits clustered around a central trajectory. The distinct orbit groupings likely arise from small perturbations or environmental noise 'kicking' the system between nearby stable trajectories within the attractor basin.
Period 2 Analysis
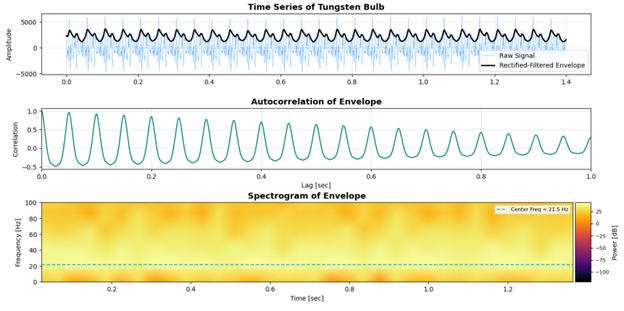
 In contrast, Period 2 captured a low-frequency response with a central modulation near 20 Hz, again processed through a Butterworth filter set to 20 Hz + 5%. The resulting signal exhibited increased irregularity, with a more diffuse and attenuated autocorrelation function—suggesting a greater influence from ambient and nonlinear thermal noise sources. The spectrogram of the period 2 signal revealed broadband components beyond the fundamental and harmonic frequencies observed in the period one orbits. This state corresponds to a decayed or semi-recovered brightness condition, in which the filament's thermal inertia and time-delayed acoustic feedback, quantified as \(\tau\) above, dominate the observed behavior. Embedded attractors from this period revealed a warped and dispersed topological structure, providing further evidence of quasi-periodic or noisy dynamics. Together, these contrasting periods illustrate the rich dynamical spectrum achievable in simple incandescent systems under driven optical-acoustic feedback.
Period 3 Analysis
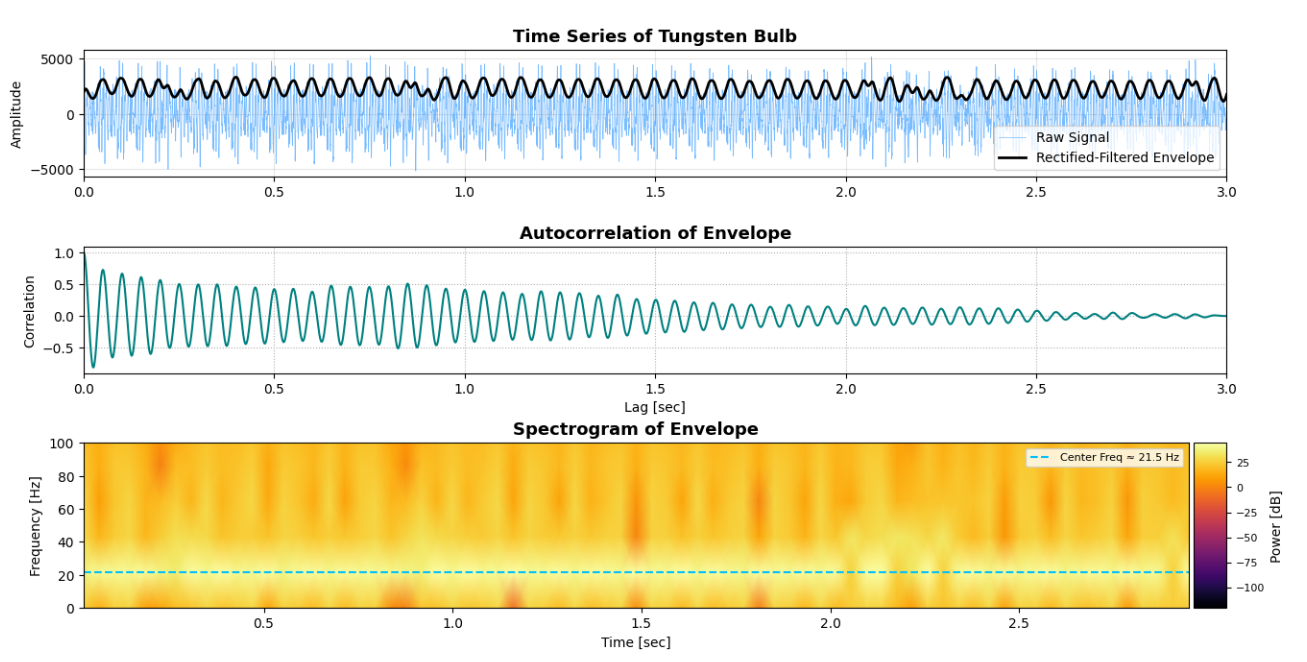
 The full-envelope analysis captures a high-resolution view of the tungsten filament's amplitude dynamics following rectification and low-pass filtering. Compared to isolated period slices, this signal reveals continuous modulation at approximately 64.6 Hz—consistent with mains-driven brightness flicker—overlaid with slower thermal decay and feedback effects. The envelope’s autocorrelation exhibits strong but gradually decaying oscillations, affirming coherent periodicity with embedded damping.
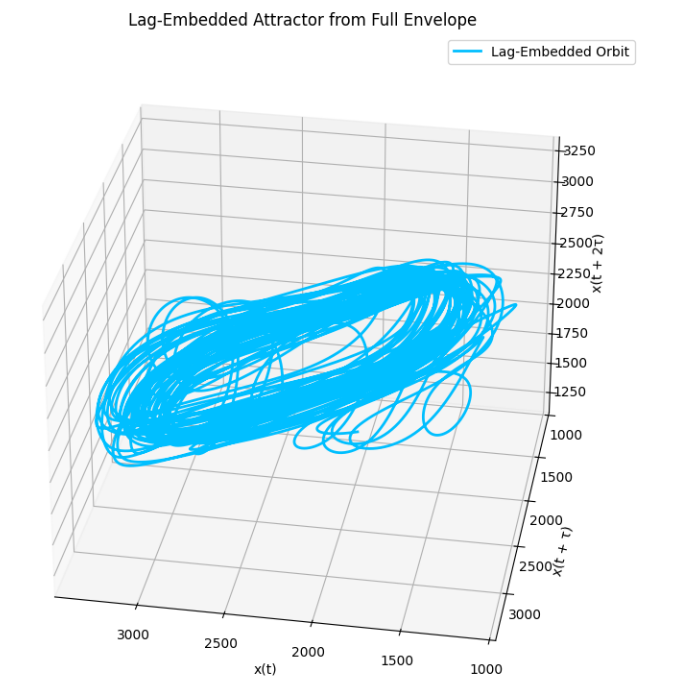
The spectrogram confirms a dominant frequency component near 64.6 Hz, with consistent energy and minor broadband tails suggesting minimal thermal noise. Notably, the 3D lag-embedded attractor formed from the entire envelope yields a densely wound, high-dimensional orbit with strong toroidal structure. This global attractor captures the full evolution of the filament’s brightness across the sample window and reveals quasi-periodic transitions potentially governed by acoustic echoes and thermal relaxation delays. The coherence of this attractor, despite system complexity, indicates that the optical-acoustic system remains dynamically organized even under extended, uncontrolled operation.
The full-envelope analysis captures a high-resolution view of the tungsten filament's amplitude dynamics following rectification and low-pass filtering. Compared to isolated period slices, this signal reveals continuous modulation at approximately 64.6 Hz—consistent with mains-driven brightness flicker—overlaid with slower thermal decay and feedback effects. The envelope’s autocorrelation exhibits strong but gradually decaying oscillations, affirming coherent periodicity with embedded damping.
The spectrogram confirms a dominant frequency component near 64.6 Hz, with consistent energy and minor broadband tails suggesting minimal thermal noise. Notably, the 3D lag-embedded attractor formed from the entire envelope yields a densely wound, high-dimensional orbit with strong toroidal structure. This global attractor captures the full evolution of the filament’s brightness across the sample window and reveals quasi-periodic transitions potentially governed by acoustic echoes and thermal relaxation delays. The coherence of this attractor, despite system complexity, indicates that the optical-acoustic system remains dynamically organized even under extended, uncontrolled operation.
References
- C. J. Brennan, “Thermal Properties of Tungsten Filaments,” General Electric Engineering Report, GE Lighting Division, Cleveland, Ohio, 1984.
- S. K. Searles, G. A. Hart, J. A. Dowling, and S. T. Hanley, “Laser beam propagation in turbulent conditions,” Applied Optics, vol. 30, no. 4, pp. 401–406, Feb. 1991.
- K. Joiner, B. Neuner III, K. Book, E. Walter, K. Liotta, B. E. Lynn, “Brightness containment and power concentration under coastal turbulence: a 2.09-micron case study,” in Proc. SPIE 13147, Laser Communication and Propagation through the Atmosphere and Oceans XIII, 131470D (2024). https://doi.org/10.1117/12.3028484